
Expertise · Insights, Reporting & Decision Support

Make information useful, not just visible.

From operational dashboards and management reporting to tailored interfaces for complex data, we design around the questions people need to answer. We connect information design with real workflows so teams can find what matters, understand the context and make more informed decisions.

01When it’s relevant

  • Teams need a shared, regular view of how operations are going.
  • Several reports exist, and people want one place that answers their questions.
  • A new service or product needs an interface for the people running it.
  • Information is available, and you want it to lead more directly to action.

02What we contribute

  • Information hierarchy
  • Comparison views
  • Trend context
  • Meaningful filters
  • Drill-downs
  • Attention states
  • Role-specific views
  • Reporting templates

Illustrative demonstration — fictional data

3Region C has been above target for 4 weeks. Review staffing before the next cycle.
RegionStatusAvg. response
Region AOn track2.1 h
Region BWatch3.4 h
Region CNeeds attention5.8 h

03How we approach it

  1. Define & ExploreWe learn which decisions the information supports, who makes them and when.
  2. Design & DevelopWe shape hierarchy, comparisons and views around those questions, then build and validate them.
  3. OptimizeWe watch how the reporting is used and refine it as questions change.
  4. …and back to Define & Explore.

04Related work

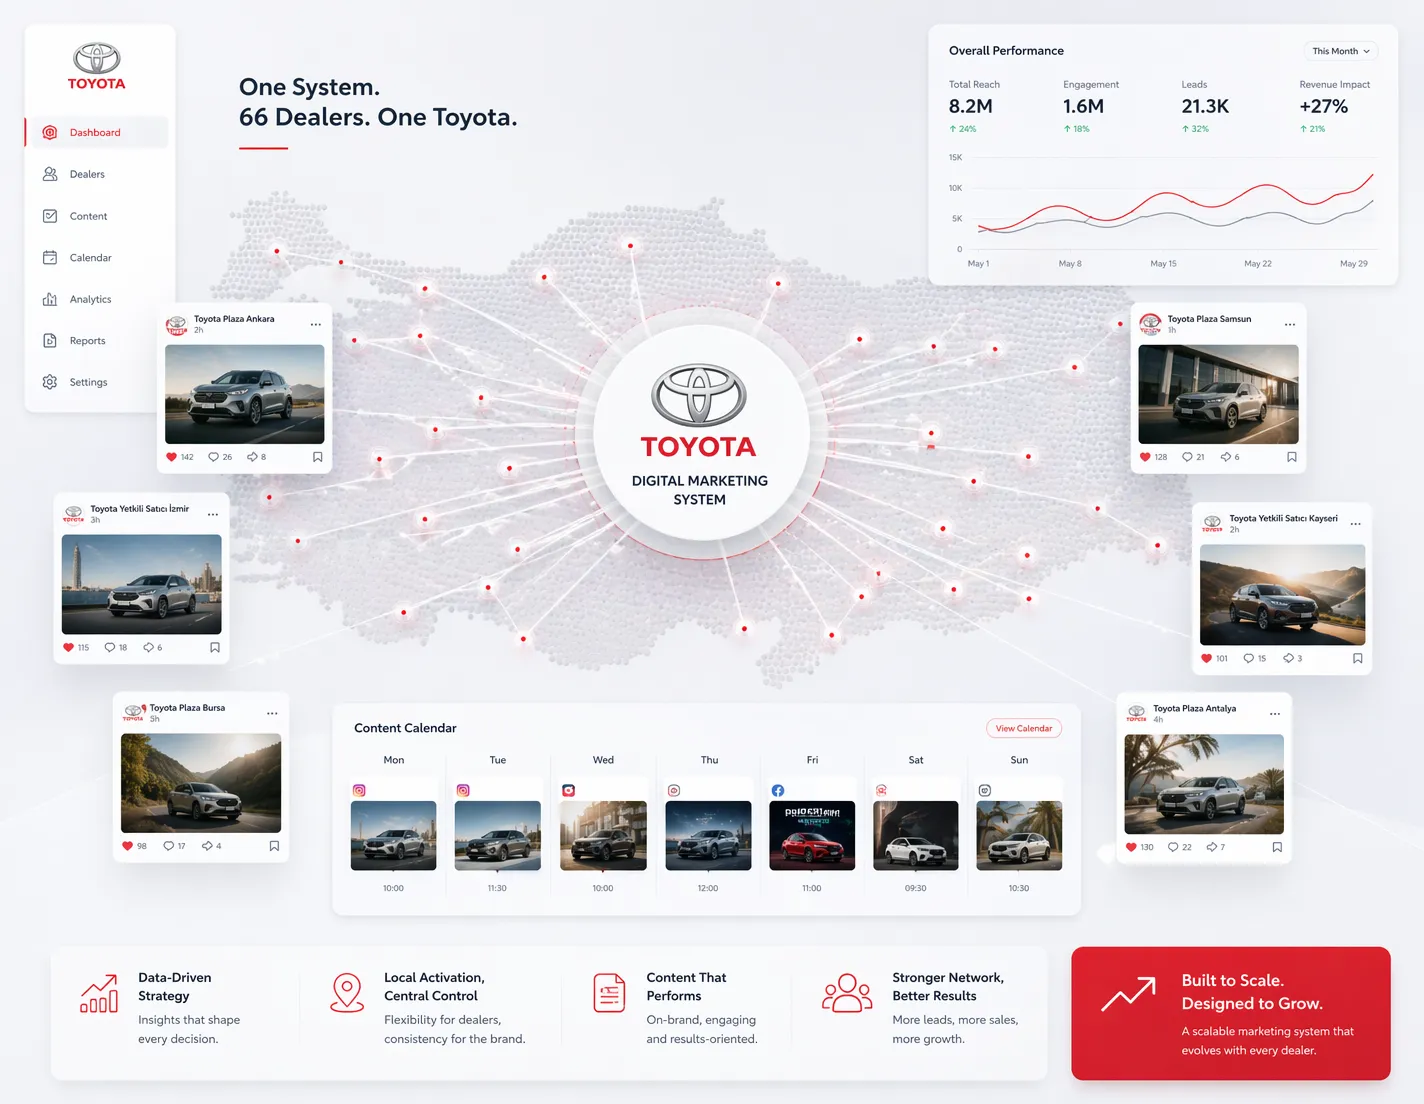
Toyota dealer network system: dealer map, content calendar and performance dashboard

Toyota

Toyota dealer network: channel management

A distributed marketing model for Toyota’s network of 66 dealerships. Central planning keeps every dealership aligned with the brand, while each one can act locally. Dedicated teams handle media planning, content production, channel management and reporting day to day.

Efabrika’s role: Efabrika designs and runs the model, from strategy and media planning to content, reporting and the supporting technology.

  • Research
  • Strategy
  • Creative Operations
  • Multi-location
  • Media Planning
  • Reporting

Toyota

Toyota dealer network: reporting dashboard

An automated reporting dashboard for the social media channels of Toyota’s dealer network. It brings each dealership’s channel data together and produces centralised and executive reports automatically, so decisions at the brand and across the network rest on the same picture. It supports the wider channel-management model.

Efabrika’s role: Efabrika designed and built the dashboard, its data connections and the automated reports, and keeps refining them.

  • Reporting
  • Data Integration
  • UX/UI Design
  • Development
  • Ongoing Support

05Ways to engage

Tell us what you’d like to understand better.

Describe the questions your team is trying to answer. We’d like to hear about it.